4 Pi Sky has today published a study of the optical and radio flux density properties of a wide range of astrophysical transient phenomena – from Galactic flare stars to extragalactic gamma-ray bursts (GRBs). The aim of the investigation was to answer the question of whether a radio transient source could be classified from an optical flux density measurement obtained through swift follow-up. In fact, this scenario may suddenly become very frequent with the recent inauguration of MeerLICHT, a robotic optical telescope that will track the new radio telescope MeerKAT, providing optical photometric coverage of any night-time radio transients discovered by MeerKAT!
By analysing approximately 12,000 pairs of radio and optical flux density measurements, we found that there was a clear separation in the parameter space of Galactic and extragalactic objects, as seen in Figure 1 from the publication reproduced below. We also saw that objects from specific populations generally clustered together as evidenced by the distribution of supernovae (SNe) and GRBs.
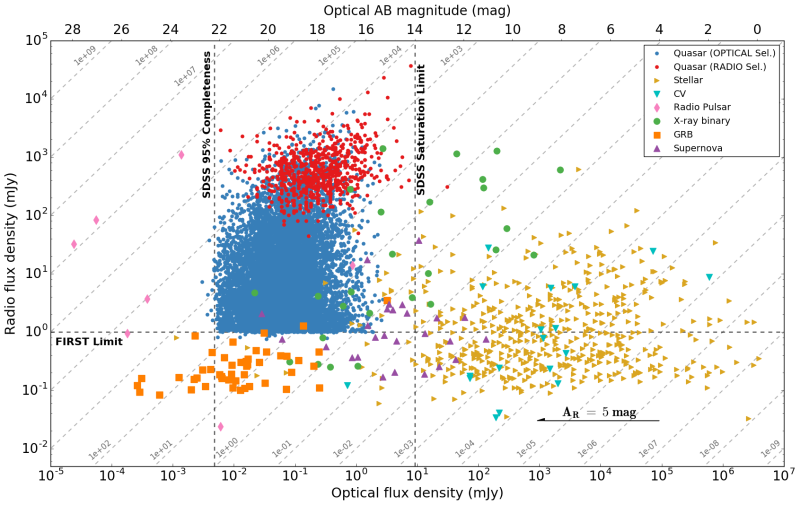
Figure 1 from the publication that shows the optical and radio flux densities of different transient phenomena plotted against one another. It shows how the majority of Galactic and extragalactic sources, such as stars and quasars respectively, are well separated.
The measurements included in the plot above are recorded at a single time, but the flux density of transients change significantly as they evolve. We explored how this would appear in the radio and optical parameter space by including a dynamic data sample that followed the radio and optical evolution over months or even years. Below is a plot showing a result of that study, specifically for SNe. It shows that many events follow a similar anti-clockwise trajectory, a feature that could help in classifying an object if an initial classification is unclear. In the paper we also explore how GRBs, X-ray binaries, cataclysmic variable and quasars evolve over time.
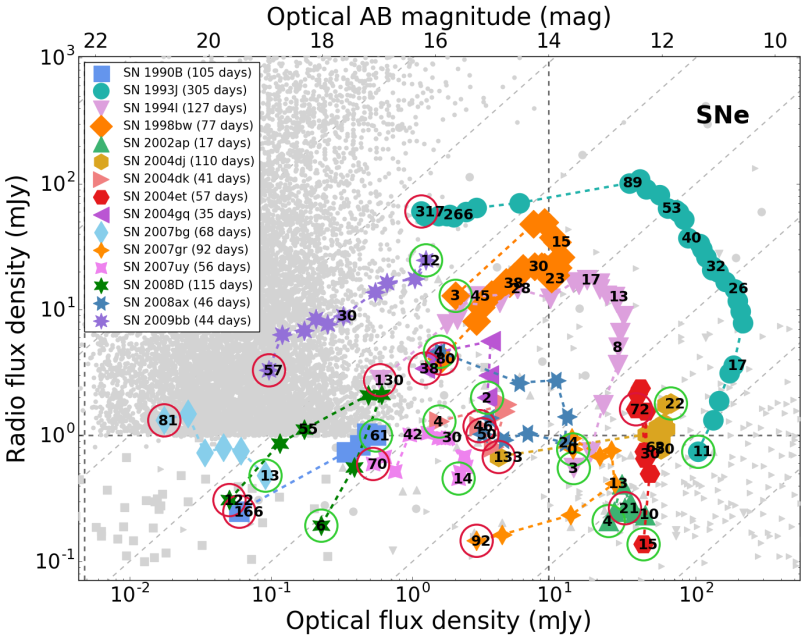
The evolution of a selection of supernova events in radio and optical flux density over time. The green and red circles signify the beginning and end of the measurements for the respective object, where as the numbers denote the time in days after the explosion date of the event.
The study is the first step in using the radio and optical flux density information of a transient as part of a classification pipeline – and will already provide a very useful reference for the MeerKAT/MeerLICHT project. As more simultaneous radio and optical data is collected thanks to projects such as that one, our understanding of the radio-optical transient sky will substantially improve and, importantly, allow us to ‘fill-in’ areas of the plot to see how populations appear beyond our current sensitivity limits.
The full paper can be found on arXiv here: https://arxiv.org/abs/1806.09815.
A GitHub repository containing the data and code to reproduce the plots can be found here: https://github.com/4pisky/radio-optical-transients-plot.
