Discovery of a Low-frequency Radio Transient near the North Celestial Pole with LOFAR

4 Pi Sky Authors: Adam Stewart / Rob Fender / Jess Broderick / Tom Hassall / Teo Muñoz-Darias / Tim Staley / Gosia Pietka / Rene Breton

See the full publication on astro-ph


Until a few years ago, the low-frequency radio transient sky was a relatively unexplored area of science. However, this is fast changing with new, low-frequency radio telescopes now fully operational and performing frequent transient surveys. 4 Pi Sky has led one of the first transient searches using one of these telescopes, LOFAR, where the North Celestial Pole (NCP) was monitored for around 400 hours over a period of four months. This resulted in the discovery of a new transient event, which is detailed in a paper due to be published in MNRAS and announced today on astro-ph.

NCP-transient-grid-new

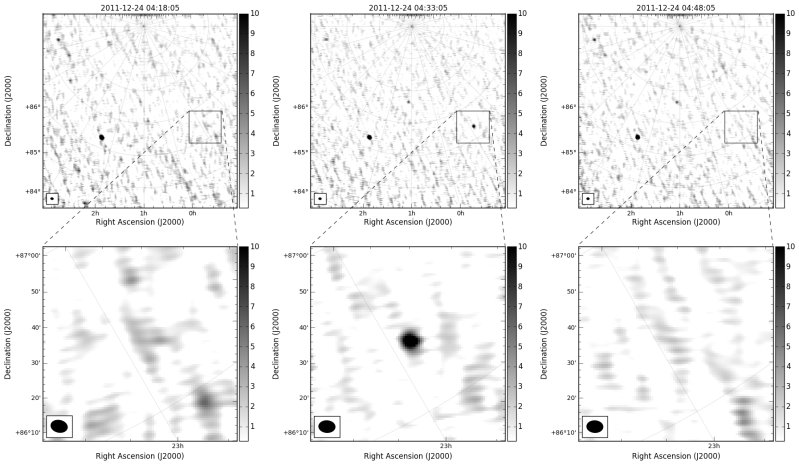
Caught: The transient as it appeared in the images generated by LOFAR, showing the transient appearing, and subsequently disappearing, from view. The lower panels display a zoom-in of the transients location.

The transient, named ILT J225347+862146, was detected in only one of 1897 60 MHz observations, with a brightness of approximately 20 Jy. It was discovered by using the LOFAR Transients Pipeline (TraP), a piece of software 4 Pi Sky helped develop. Each of these observations was 11 minutes in duration, so it was possible to probe the transient at a higher time resolution by splitting the data into two minute observations. In doing this, it was found that the transient only appears to be active for only 4-6 minutes of this observation.

2minlightcurve

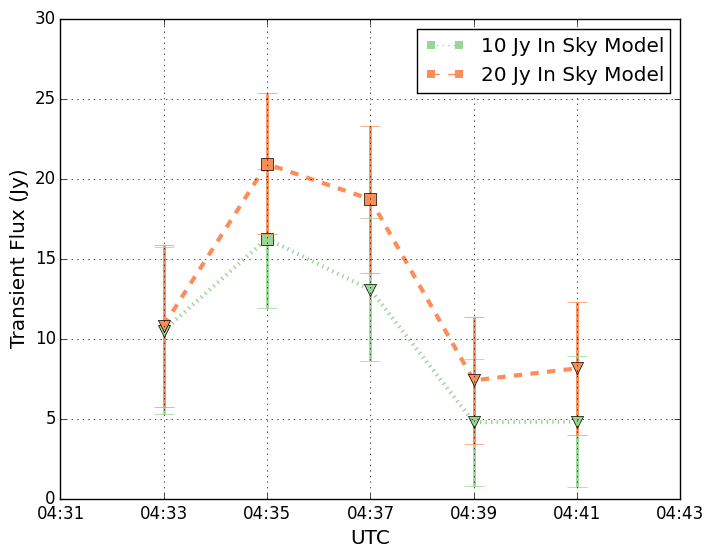
A brief burst: The light curve of the transient object during the 11 minute period of the observation, showing a sudden appearance along with a just as fast decline. The different light curves denote slightly different processing methods of the data, but both show the same trend.

But what is ILT J225347+862146? No objects at the transients location have been detected in historical radio catalogues, nor were there any obvious candidates in optical follow-up observations performed with the Liverpool Telescope. Possibilities were explored; from extragalactic fast radio bursts, to perhaps a nearby flare star, but while some of the characteristics of this transient were consistent with previously detected events from these objects, others were not. One feasible explanation is that could be from a nearby substellar object, for example a brown dwarf, which are difficult to detect. However, at this stage, the true origin of ILT J225347+862146 remains a mystery.

With the continual, and rapid advance in technology and techniques of low-frequency radio astronomy, then ILT J225347+862146 may be the first of many such transients of this nature to be discovered.

“TraP”, a transient detection pipeline, gets its first public release

We’re happy to announce that the TraP, an image-plane transients-detection pipeline, has reached version 2.0 and been made publicly available for the first time, along with an accompanying paper (to be published in Astronomy and Computing). The TraP project was born out of the UvA LOFAR-transients group, with close collaboration from the 4 Pi Sky team over the past few years.

The TraP is what’s known as a source-cataloguing pipeline, which means that it processes images one-by-one, extracting source positions and flux intensities from each image, then attempts to match up these measurements into lightcurves spanning the entire dataset. If something new pops up, or if a source shows significant variability in its lightcurve, the TraP will flag this up for further investigation. This approach has been used before (e.g. for the CRTS project), but the TraP is novel for a few reasons. Key among these is fact that TraP can be run on a plain-old stack of images, without the need for a carefully preprocessed ‘deep’ image (an image of unusually high quality made by summing the best images from a dataset) to seed the catalogue beforehand. This makes it possible to run the TraP on a sequence of images as they are observed in near real-time. It can also collate data from across a range of frequency bands, which is vital in the current era of wide-band observatories and multi-observatory observing campaigns.

A Banana screenshot

A screenshot from Banana, the web-based graphical interface for browsing TraP results.

Additionally, the TraP project has embraced some ways of working that are still quite unusual in astronomy. For starters, the graphical interface used to give an overview of results is a Django-powered web-interface. This means that while all the software and results are stored and run on a heavy-duty central server, end-users can still browse through the results in a intuitive manner using the web front-end, Banana (don’t ask). The TraP has grown into a significant software-project by most standards (~20,000 lines of Python and SQL code, ~350 unit-tests), with a diverse group of contributors. To ensure things kept running smoothly we employed comprehensive unit-testing, continuous integration, issue-tracking and code-review, which should put the project in good stead for a more open development model.

The TraP has already been put to good use on data from the LOFAR RSM, ALARRM, and JVLA-CHILES surveys (see our projects page). Hopefully this open release will allow profitable use with many more datasets.

The variability timescales and brightness temperatures of radio flares from stars to supermassive black holes

4PiSky Authors: Gosia Pietka / Rob Fender

See the full publication on Astro-ph.


Synchrotron-emitting radio sources can undergo flaring events that cause dramatic variability in their lightcurves. One of the earliest models for these radio flares describes a cloud of relativistic particles and magnetic fields expanding into a surrounding medium. In this model, at a given frequency, the evolution of the light curve of an expanding cloud is determined by increasing transparency, causing an increase in the flux density, with expansion losses reducing the internal energy.

Exponential rise timescale as a function of peak radio luminosity for the entire set of radio flares studied. Overplotted are lines corresponding to a fixed minimum brightness temperature (TB,min ), demonstrating that TB,min is an increasing function of luminosity, peaking just above the theoretical limit of 10^12 K for the most luminous AGN.

Continue reading

A prompt radio transient associated with a gamma-ray superflare from the young M dwarf binary DG CVn

4PiSky Authors: Rob Fender / Gemma Anderson / Tim Staley

ADS Link: http://adsabs.harvard.edu/abs/2014arXiv1410.1545F


On April 23, 2014, the Swift satellite detected a gamma-ray superflare from the nearby star system DG CVn. This system comprises a M-dwarf  binary with extreme properties: it is very young and at least one of the components is a very rapid rotator. The gamma-ray superflare is one of only a handful detected by Swift in a decade. As part of our AMI-LA Rapid Response Mode, ALARRM, we automatically slewed to this target, were taking data at 15 GHz within six minutes of the burst, and detected a bright (~100 mJy) radio flare. This is the earliest detection of bright, prompt, radio emission from a high energy transient ever made with a radio telescope, and is possibly the most luminous incoherent radio flare ever observed from a red dwarf star.

Radio1

X-ray (Swift) and 15 GHz radio (AMI, operating in the ALARRM programme) observations of a superoutburst from the the extreme flare star DG CVn. Radio emission was strongly detected already only six minutes after detection of the initial burst by Swift. This demonstrates both the feasibility and scientific potential of very rapid response modes for radio telescopes. 

Continue reading

Probing the bright radio flare and afterglow of GRB 130427A with AMI

4PiSky Authors: Gemma Anderson / Tim Staley / Rob Fender

ADS Link: http://adsabs.harvard.edu/abs/2014MNRAS.440.2059A


AMI-LA Rapid Response Mode (ALARRM) observations of the nearby bright gamma-ray burst GRB 130427A allowed the 4 Pi Sky team to obtain one of the earliest radio detections of a GRB to date. As soon as this GRB had risen above the horizon the AMI-LA quickly slewed to its position detecting radio emission within 8 hours post-burst. Further follow-up AMI observations showed the radio flux to increase in brightness before rapidly declining one day later. Such a sudden decline in radio emission is very rare and has only been observed from a few GRBs.

figure2

The AMI 15.7 GHz and VLA 14 GHz light curve of GRB 130427A overplotted with the afterglow model derived by Perley et al. (2014, solid line) showing the individual contributions from the reverse shock (short dashed line) and forward shock (long dashed line). The AMI peak at 16 hrs is one of the earliest radio peaks ever observed from a GRB.

Continue reading